

Customer Inquiry Volume: Count It Correctly, Forecast the Lag, Reduce Repeat Work
Define customer inquiry volume, forecast order-cohort delays and non-order demand, and reduce pre-purchase questions with a downloadable worked example.

A customer emails about a missing screwdriver bit, opens a chat, and calls before either message gets a reply. Your team handles three contacts. The help desk may create two tickets. The customer still has one unresolved problem.
Customer inquiry volume is the number of customer questions or requests received during a defined period, counted using a stated unit. For staffing, keep the contacts that create work. For prevention, also group contacts that concern the same underlying issue. One count can’t reliably do both jobs.
The practical task is to connect those records to the questions customers ask, the orders that generated them, and the time they arrive. The downloadable example below shows why this week’s orders alone can miss part of this week’s workload.
Define inquiries, contacts, tickets, and unique issues
Start your customer inquiry volume definition with a reporting window and a counting unit. “We received 600 inquiries” could mean 600 incoming messages, conversations, tickets, or distinct issues. Those numbers change differently when customers follow up or your software merges records.
| Count | Unit to record | What it helps answer |
|---|---|---|
| Contacts | Each call or defined incoming interaction | How much work reached the team? |
| Tickets | Help desk records created under current rules | How much recorded work entered the queue? |
| Unique issues | Related contacts grouped under a consistent issue rule | Why did customers need help? |
| Customers | Distinct identified people in the window | How many people contacted us? |
Ticket volume can fall after a merge-rule change even if contact volume is unchanged. A conversation may contain several messages. Define the contact boundary, including whether a reopened conversation counts again. Keep that definition stable when comparing periods.
For the missing-bit example, link the contacts to an issue ID using the relevant customer, order, and reason. Preserve the original contact IDs. A follow-up still consumes handling time even when it isn’t a new problem.
Avoid guessing which contacts belong together
The same customer can have two different problems with one order. Two people can share a phone number. A fixed 24-hour deduplication rule may split a long unresolved issue or merge unrelated requests.
Use explicit links where you have them, such as a reopened case or a confirmed order-and-reason match. Keep uncertain matches separate for review. Record the grouping method and version so an apparent reduction in unique issues isn’t merely a new matching rule.
Add reason, channel, language, arrival time, and order linkage to the working dataset. Use an “unknown” reason when the evidence isn’t sufficient; inspect those records rather than forcing them into a convenient category. Keep personal identifiers in the approved source system and use pseudonymous IDs in planning exports.
Forecast volume with order cohorts and non-order demand
Customer inquiry volume estimation needs both the amount of demand and its timing. A period ratio, such as contacts received this week divided by orders placed this week, can be a useful descriptive signal. It isn’t automatically the contact rate generated by those orders.
A delivery question this week may come from an order placed last week. A prospective buyer asking whether a bit fits their tool may never order. Account-access problems may have no order at all.
Separate three inputs before forecasting:
- Order-linked contacts, grouped by the order cohort and elapsed time since the chosen order event.
- Pre-purchase demand, estimated from relevant history such as product traffic, campaigns, or prior launches.
- Other non-order demand, such as account questions, subscriptions, and general service requests.
Choose a consistent order event. If you measure from order placement, don’t quietly switch the denominator to shipped orders. Shipment dates can be another useful input for delivery questions, but they define a different model.
What the contacts-per-order calculation can tell you
Suppose 12,000 orders generated 3,900 linked contacts during a fully observed, chosen follow-up window. That cohort rate is 3,900 ÷ 12,000 = 0.325 contacts per order, or 32.5 per 100 orders. Applying it to 5,000 comparable new orders gives an expected 1,625 contacts over the same follow-up window.
That calculation doesn’t say all 1,625 will arrive next week. It also excludes unlinked pre-purchase and other demand. Its usefulness depends on comparable buyers, products, delivery conditions, and a sufficiently mature historical cohort.
If the most recent orders haven’t had time to generate their later contacts, don’t compare their partial rate with a fully observed older cohort. Label the follow-up age or wait until equivalent periods have elapsed. Otherwise, the newest cohort can look artificially easy to support.
Build a forecast you can test against actual contacts
The inquiry forecast worksheet is a synthetic weekly example. It uses three lag buckets for order-linked contacts: the order week, the following week, and the week after that. All inputs are teaching values, not Callnovo customer results.
| Source of this week’s contacts | Orders in that cohort | Expected contacts per order in this lag bucket | Expected contacts this week |
|---|---|---|---|
| Orders placed this week | 1,000 forecast | 0.200 | 200 |
| Orders placed last week | 800 recorded | 0.100 | 80 |
| Orders placed two weeks ago | 600 recorded | 0.025 | 15 |
| Pre-purchase and other non-order demand | Separate forecast | Separate forecast | 50 |
| Total | 345 |
The calculation is (1,000 × 0.200) + (800 × 0.100) + (600 × 0.025) + 50 = 345 contacts. A shortcut using only this week’s orders gives 1,000 × 0.325 = 325. Adding the same 50 non-order contacts makes 375. That shortcut moves the cohort’s full follow-up demand into its order week and ignores the actual sizes of the older cohorts.
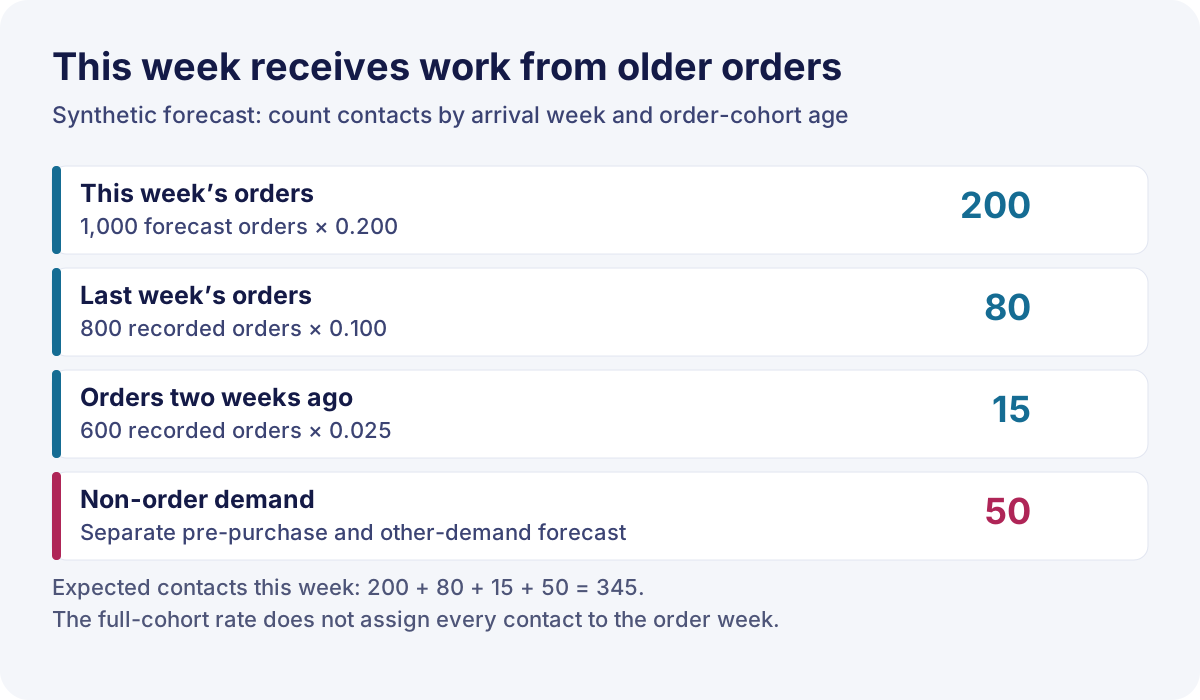
In this small model, the lag rates sum to 0.325. A real model may need longer buckets, a longer tail, separate products, and different rates by buyer group. Start with the simplest version that can be tested against your records. Don’t multiply an unexplained “viral adjustment” into every reason category.
Backtest the decision you actually have to make
Choose a past planning date. Use only the order forecast, mature contact history, and campaign information available on that date. Predict the next week, then compare with the contacts actually received. Repeat across several planning dates, including busy and ordinary weeks.
This follows the rolling-origin approach in Hyndman and Athanasopoulos’ forecasting textbook, section 5.10: training data precede the test period, and the evaluation horizon should match the forecast’s intended use. A one-day test doesn’t validate a plan made several weeks ahead.
Record forecast error in contacts, along with whether the forecast repeatedly comes in too low or too high. Break the error down by reason and channel. A correct total can still leave you short of the language or product skills the actual contacts require.
If actual volume were 360 against this example’s 345, the shortfall would be 15 contacts. Investigate which input missed before changing every rate. That comparison is another hypothetical calculation, not a prediction of the worksheet’s accuracy.
The contact forecast is still only an input to staffing. Handling time, arrival concentration, concurrency, and service commitments determine the work required. For voice contacts, the Erlang calculator can help explore an interval-based staffing scenario after you’ve checked its model assumptions.
Reduce pre-purchase inquiries at the source
To reduce pre-purchase inquiries, inspect what a buyer needs to know before choosing the product. If sizing, compatibility, contents, or intended use are hard to find, a faster reply doesn’t remove the next buyer’s need to ask.
| Repeated pre-purchase question | Information to inspect | Change to test |
|---|---|---|
| “Will this fit my tool?” | Exact compatibility and excluded models | Put the fit information beside the purchase decision |
| “Does the kit include that bit?” | Labeled contents and separate-part availability | Show the included parts clearly |
| “Can a beginner use this?” | First-use steps and demonstrations | Add an accessible demonstration with the relevant steps |
| “Will it arrive before Friday?” | Destination-specific delivery information | Show the applicable estimate and its conditions |
Measure the question category after the change, using comparable exposure where available. For pre-purchase questions, product-page visits may be a more relevant context than completed orders. Keep the raw question count too: a lower rate during a much larger campaign can still produce more contacts.
Buyer mix needs testing during either kind of peak
A seasonal promotion can attract first-time buyers. A creator campaign can reach experienced customers. Compare the actual mix rather than assuming that seasonal peaks preserve the old contact rate and viral peaks always raise it.
In Callnovo.ai’s published hardware-tools support case, a kit reached DIY beginners through TikTok creators. The account description explains three concrete changes: video replies for how-to questions, a SKU list covering 24 parts for replacement requests, and training on the terms buyers used for the bits.
Those mechanisms address different problems. A video can help a buyer follow a procedure. A parts list helps a human agent identify a missing component. Product terminology helps the agent understand the question. A missing part still requires a fulfillment action; an answer alone doesn’t complete that job.
For your own operation, make the permitted replacement and refund actions explicit. State which cases agents can complete and which require approval. If an approval is required, give the waiting customer a next step and assign someone to follow through. Don’t assume that a faster acknowledgement means the replacement has shipped.
Send recurring reasons back to the product team. If customers repeatedly confuse two parts or miss a setup step, compare the instructions and packaging with the language in their questions. Use the next content change as a test, then check whether the same issue recurs.
Handle the remaining high-volume inquiries
Even a useful answer library won’t eliminate delivery exceptions, damaged items, account problems, or requests requiring judgment. For high inquiry volumes, sort the remaining work by urgency, existing commitments, required skills, and available authority.
Keep the arrival forecast separate from backlog. New contacts expected this week and unresolved work carried into the week are different inputs to the team’s workload. Include due callbacks and follow-ups; they still need time even if no new ticket is created.
| Planning question | Information to have ready |
|---|---|
| What needs attention first? | Risk, deadline, age, and customer commitment |
| Who can complete it? | Language, product knowledge, permissions, and escalation owner |
| What will the customer hear? | Acknowledgement, next step, and a realistic follow-up commitment |
| What changes for the peak? | Staffed hours, handoff plan, training material, and access readiness |
If a marketplace imposes response targets, check the current policy for your market and channel. Match its definition of response and excluded hours to your dashboard. A resolved conversation, an automated greeting, and a qualifying first response may be different events.
Callnovo.ai combines customer support teams with the HeroDash platform. For a peak, bring the reason split, required languages, coverage window, and access requirements into the staffing discussion. Product training and system access need to be ready for the work you’re assigning; a generic headcount request leaves those requirements unstated.
For the channel and assignment details, use the guides to social media customer service and ticket triage. Keep this forecast focused on the demand those workflows will receive.
Check whether lower volume means better outcomes
After a help-center or automation change, check whether customers completed the task. Fewer contacts can reflect clearer answers, but they can also reflect a harder-to-find support route or customers leaving without help.
Gartner’s August 2024 release reported that 14% of issues were fully resolved through self-service in a survey of 5,728 customers conducted in December 2023. That’s historical survey context for measuring resolution separately from channel use, not a current target for your business.
Track same-issue recontacts across the channels you can reliably link. Specify the follow-up window and keep cases that haven’t completed it separate. Customer satisfaction, first-contact resolution, unresolved backlog, and the completion event for the task give different pieces of evidence.
Use a small review sample to understand the mechanism. For a replacement, inspect whether the correct item was authorized and dispatched. For a pre-purchase compatibility question, inspect whether the answer contained the applicable product information. If the required evidence is absent, label the outcome unknown instead of counting silence as success.
Keep the baseline grouping rules during the comparison, or recalculate both periods under the revised rules. Record campaign, order-volume, and product changes that may explain the difference. A decline after a content update alone doesn’t establish that the update caused it.
References
- Hyndman and Athanasopoulos, OTexts. Forecasting: Principles and Practice, third edition, section 5.10: Time series cross-validation.
- Gartner. 2024. News release on a December 2023 customer self-service survey.
Three questions before your next spike
- Can you distinguish contacts, tickets, and unique issues? If not, fix the unit before comparing volume or estimating work.
- Does the forecast include contacts from older orders and demand without an order? If not, add those components before turning the total into a staffing plan.
- Which pre-purchase question could a buyer answer from the product page, and what evidence would show the change helped? If you can’t name both, inspect a sample of real questions before adding more FAQ text.
Use customer inquiry volume to connect demand to a specific next action: repair missing information, test the forecast, or staff the work that remains.